What Are Mean Median Mode Range? Understanding Essential Statistical Concepts

Statistical concepts are crucial in the field of mathematics, as they allow individuals to analyze data effectively. Mean median mode range are fundamental terms that are essential to understand. This article will delve into these concepts' definitions, formulas, and practical applications, shedding light on their significance in both academic and real-world contexts. Whether you're a student, researcher, or professional, having a solid understanding of these concepts is necessary for making informed decisions and drawing accurate conclusions from data. So, let's dive in and explore the fascinating world of statistics!
Mean Median Mode Definition: Unveiling the Basics
Let’s dig deeper and look at the Mean Median Mode definition in detail.
Mean: The Heart of Data Averages
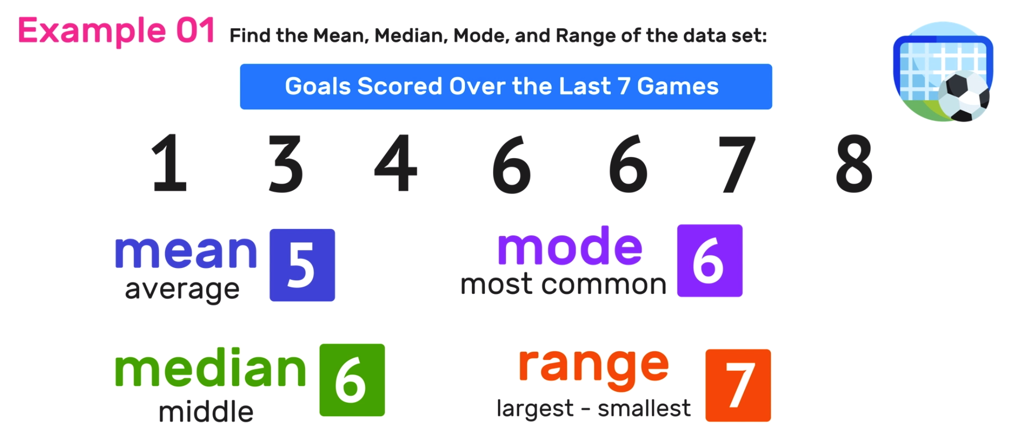
At its core, the mean (the first one in mean median mode range) is a statistical measure representing a dataset's average value. Calculated by summing up all values and dividing by the total count, the mean offers a snapshot of the data's central tendency. It serves as a pivotal tool in understanding the "typical" value within a set of data points. With its innovative capabilities, even complex calculations involving mean can be effortlessly tackled.
Median: Unveiling the Middle Ground
The median, a vital statistical concept, is the middle value in a dataset when arranged in ascending or descending order. This value serves as a robust indicator of central tendency and is particularly valuable when handling datasets that contain outliers. The user-friendly interface ensures that calculating the median becomes an intuitive process, aiding users in efficiently handling data analysis tasks.
Mode: Identifying the Most Common Value
In scenarios where finding the most frequently occurring value is paramount, the mode takes the spotlight. The mode helps identify the most common value in a dataset, allowing researchers and analysts to uncover patterns and trends. The incorporation of intuitive tools streamlines the identification of modes within datasets, making it a go-to choice for those dealing with data-heavy tasks.
Range: Gauging Data Dispersion
While the mean and median provide insight into central tendency, the range focuses on the spread of the data. By calculating the difference between the highest and lowest values, the range offers a glimpse into the data's variability. Effortlessly handling range calculations, users are freed from the complexities of manual computations.
Now we know the mean median mode definition, next we are going to discuss and use mean mode median formula to calculate each one individually.

Unlocking the Mean Mode Median Formula
To compute these statistics, understanding the formulas for Mean Mode Median Formula is crucial. Let's consider the following data set for our examples: [12, 15, 18, 22, 22, 25, 27, 30, 30, 33].
Mean Formula:
The mean can be calculated by summing up all values (Σx) and then dividing by the total count (N).
Mean (μ) = Σx / N
Using the formula above, in our example data set, the mean is calculated as:
Mean = (12 + 15 + 18 + 22 + 22 + 25 + 27 + 30 + 30 + 33) / 10 = 24.4
Median Formula:
To find the median, arrange the data in ascending order and identify the middle value. If N is odd, the median is the middle value; if N is even, the median is the average of the two middle values.
If N is odd:
Median = Middle Value
If N is even:
Median = (Middle Value 1 + Middle Value 2) / 2
Median = (22 + 25) / 2 = 23.5.
Mode Formula:
The mode is simply the value that appears most frequently in the dataset. The mode using the above dataset is:
Mode = 22.
Range Formula:
The range is the difference between the dataset's highest value (max) and the lowest value (min).
Range = Max Value - Min Value
Range, using the above dataset, is calculated as:
Range = max - min = 33 - 12 = 21
Now you know Mean Median Mode Formula, let’s discuss how we can apply all these in real life.
Applying Mean Median Mode Definitions in Real Life
In an era driven by data, understanding mean, median, mode, and range extend beyond the classroom. These concepts find their way into diverse fields, from analyzing market trends to interpreting medical data. For instance, imagine you are a business owner seeking to understand customer spending habits. Utilizing the mean could provide insights into average purchase amounts, while the median might offer a better picture of typical spending, considering potential outliers.
Uses of Mean, Median, Mode, and Range: Insights into Diverse Fields
In the world of data analysis, Mean, Median, Mode, and Range stand as essential tools. They find practical applications in statistics, finance, and business, offering straightforward ways to grasp data distributions and central trends.
Application Across Fields: Statistics, Finance, and Business
In the realm of statistical analysis, the Mean, Median, Mode, and Range serve as essential tools for extracting insights from data across various domains. These measures play a pivotal role in fields such as statistics, finance, and business, offering distinct perspectives on data distributions and central tendencies.
Statistics
Mean Median Mode Range are fundamental in statistics for describing the distribution of data sets. The Mean provides the arithmetic average of values, while the Median represents the middle value when data is arranged in ascending order. The Mode indicates the most frequently occurring value, and the Range showcases the spread between the highest and lowest values. These measures collectively offer a comprehensive understanding of data variability.
Finance
In the financial realm, these measures aid in risk assessment and investment decisions. The Mean helps gauge the expected returns of investments, providing insights into potential profitability. The Median and Mode are used to understand the central tendency of financial indicators, assisting in identifying trends and anomalies. The Range provides a sense of variability in financial data, enabling risk evaluation.
Business
Businesses leverage these measures for decision-making and performance evaluation. The Mean assists in analyzing sales figures, customer feedback scores, and other quantitative metrics. The Median helps account for outliers that could skew perceptions of business performance. The Mode is valuable for identifying popular product choices or service preferences. The Range aids in identifying potential areas for optimization or improvement.
Advantages and Disadvantages
Mean Advantages: The Mean is highly sensitive to all data points, providing a comprehensive view of the dataset. It's useful for datasets with a symmetrical distribution.
Mean Disadvantages: Outliers can significantly impact the Mean, potentially leading to skewed results. It might not accurately represent the data if the distribution is highly skewed.
Median Advantages: The Median is robust against outliers, making it suitable for skewed distributions. It accurately represents the middle value, even in the presence of extreme values.
Median Disadvantages: It might not fully capture the distribution's characteristics for datasets with complex shapes or multiple modes.
Mode Advantages: The Mode highlights the most frequent value, making it useful for identifying peaks in data distribution and categorical data.
Mode Disadvantages: It might not exist if all values are unique or if no value repeats frequently.
Range Advantages: The Range provides a simple measure of data spread and variability.
Range Disadvantages: It's highly influenced by outliers and doesn't consider the distribution's full shape.
Introducing MathMaster: Your Math-Solving Companion
If the intricacies of mean, median, mode, range still seem daunting, fear not. Our innovative math app, MathMaster, is designed to simplify these calculations and make statistics approachable for everyone. Whether you're a student grappling with classroom exercises or professional navigating data-driven decisions, MathMaster is your trusted companion.
In Conclusion: Connecting the Dots
In conclusion, mean median mode range are essential statistical concepts that underpin data analysis and decision-making. Their definitions, formulas, and practical applications shape our understanding of data distribution, central tendency, and variability. By harnessing the power of MathMaster, these concepts become more accessible, enabling individuals to conquer mathematical challenges confidently. As you embark on your data exploration journey, remember that these fundamental concepts are not just numbers — they are gateways to informed insights.