MathMaster Blog
aх^3 + bх^2 + cx + d = 0 is a generalized form of a cubic equation. The graph of a cubic function can have a maximum of 3 roots.
The basic cubic function (which is also known as the parent cubic function) is f(x) = х^3
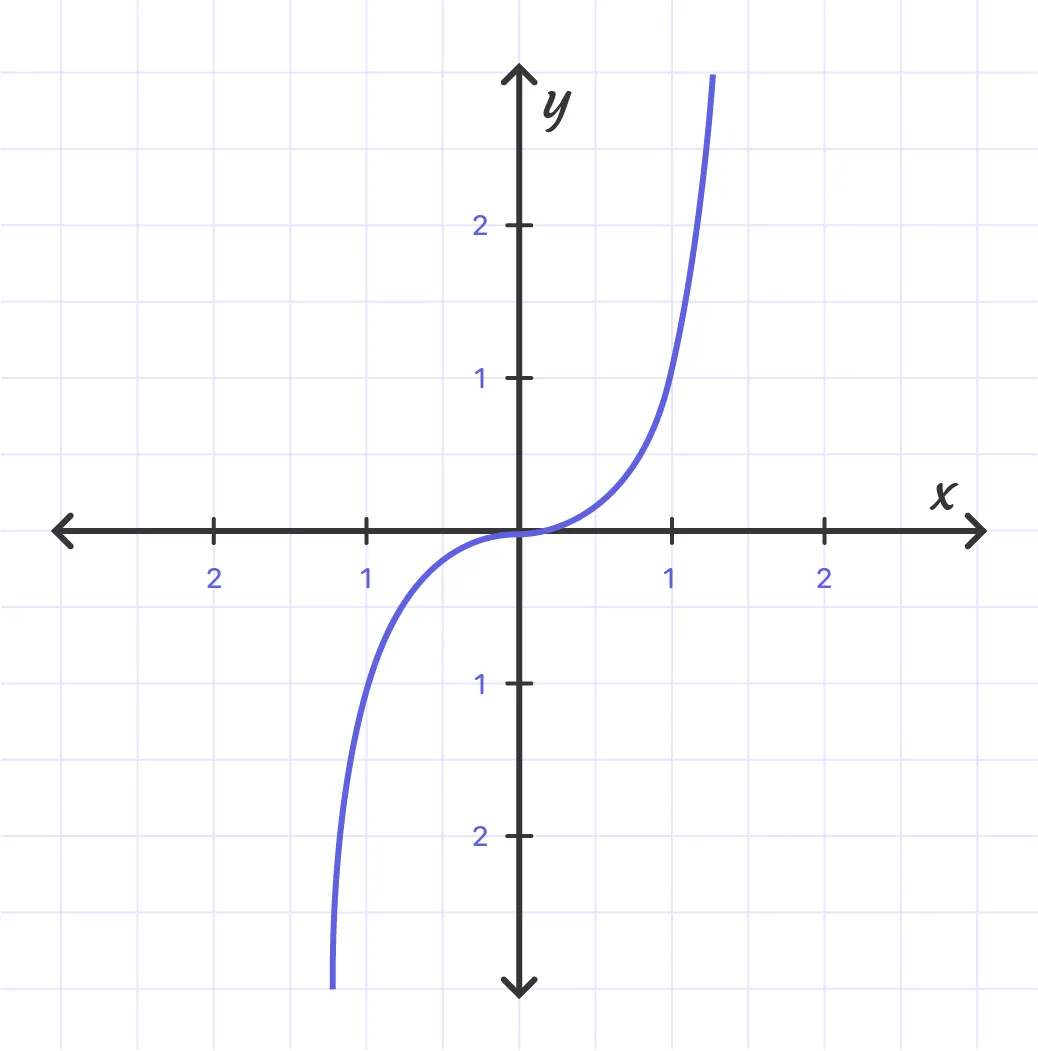
- The domain and range of a cubic function is the set of all real numbers.
- To find the x-intercept(s) of a cubic function, we just substitute y = 0 (or f(x) = 0) and solve for x-values.
- To find the y-intercept of a cubic function, we just substitute x = 0 and solve for the y-value.
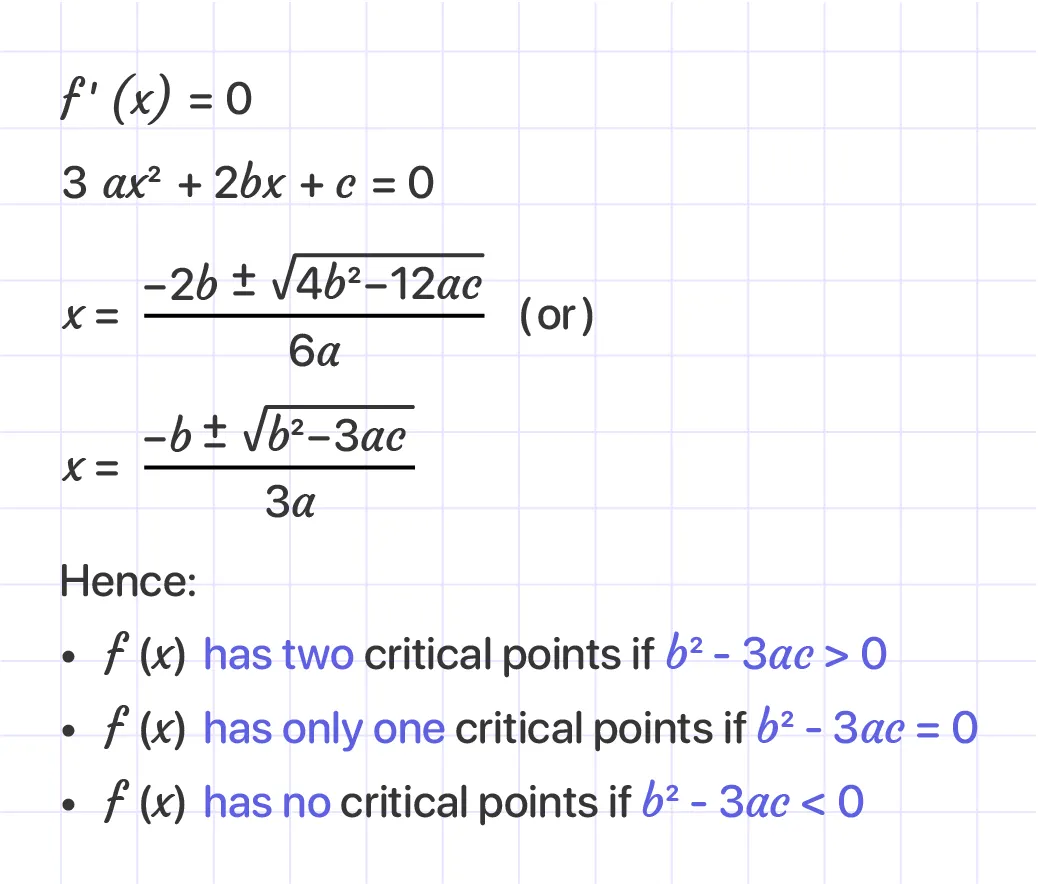
- To find the critical points of a cubic function f(x) = aх^3 + bх^2 + cx +d = 0, we set the first derivative to zero and solve via quadratic equation formula.
For instance:
The end behavior of the cubic function is as follows:
-
If the leading coefficient is positive (a > 0):
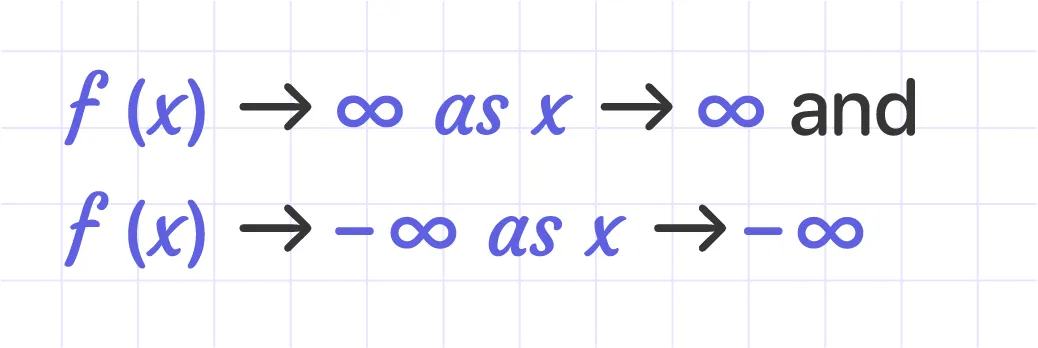
The graph is from bottom to top in this case.
-
If the leading coefficient is negative (a < 0):
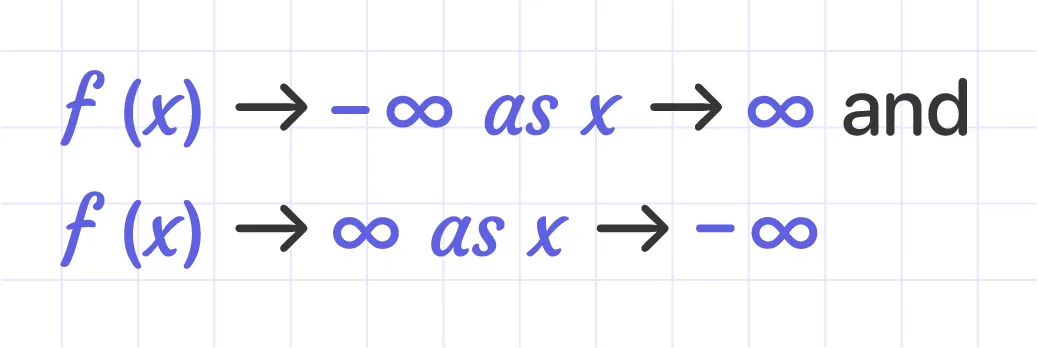
The graph is from top to bottom.
Example:
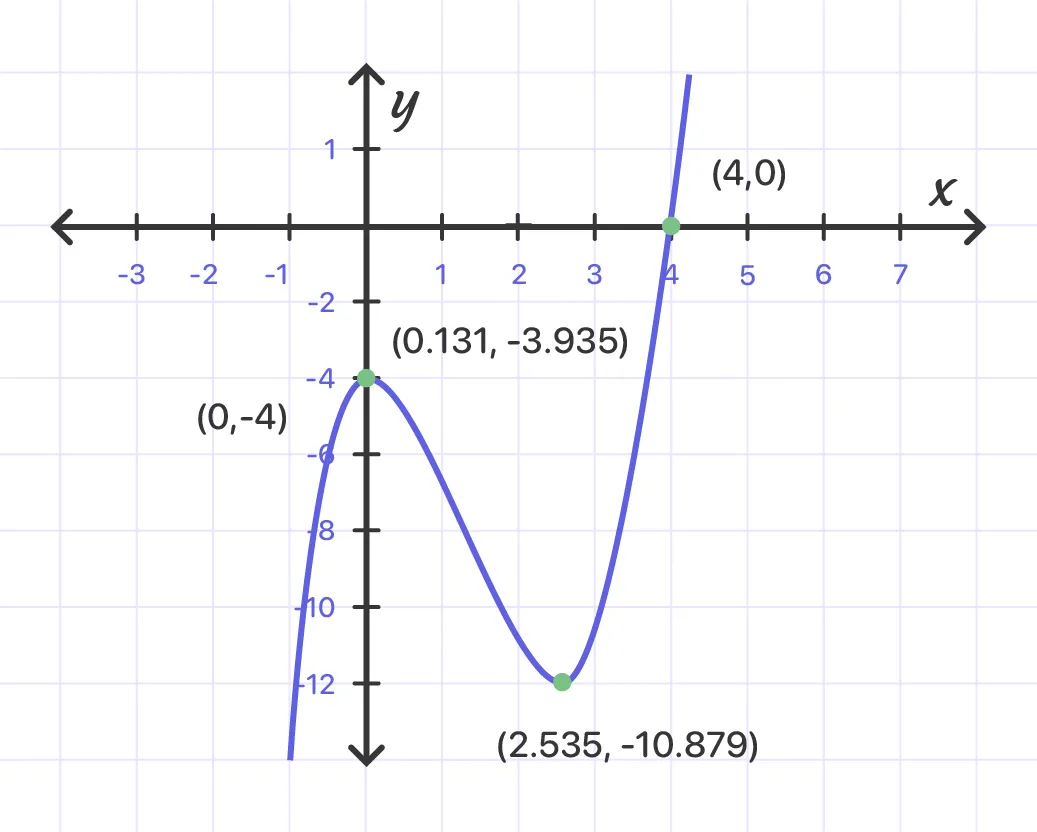
Graph f(x) = х^3 - 4х^2 + x - 4 .
Solution:
Step1:
Find the x-intercept(s). To do this, substitute f(x) = 0. Then, solve:
х^3 - 4х^2 + x - 4 = 0
х^2(x - 4) + 1(x - 4) = 0
(x - 4)(х^2 + 1) = 0
x- 4 = 0; х^2 + 1 = 0
x = 4; х^2 = -1
x = 4; x = +- i
As complex numbers can’t be x-intercepts, f(x) has only one x-intercept - (4, 0).
Step2:
Find the y-intercept. To do this, substitute x = 0.
Then, f (x) = -(0)^3 + 4(0)^2 - 4 = -4
Therefore, the y-intercept of the function is (0, -4).
Step3:
Find the critical point(s) by setting f'(x) = 0.
3x^2 - 8x + 1 = 0
By quadratic formula, $(-8 \pm \sqrt{64 - 12}) \div 6 \approx 0.131 and 2.535$
Step4:
Substitute each of the critical points' y-coordinates into the above function to find the matching y-coordinate(s).
f(0.131) $\approx$ -3.935
f(2.535) $\approx$ -10.879
So, the critical points are (0.131, -3.935) and (2.535, -10.879).
Step5:
Find the end behavior of the function.
Since the leading coefficient of the function is 1, its end behavior is
f(x) -> +∞ as x -> +∞
f(x) -> -∞ as x -> -∞
Step6:
Plot the points from steps 1, 2, 4.
Step7:
Connect the points by the curve.
Answer:
