MathMaster Blog
The graph of any quadratic function f(x) = aх^2 + bx + c is called a parabola.
Here, a, b, and c represent real numbers, where a≠0.
We need to include some particular points while graphing parabolas.
- The y-intercept is the point where the graph intersects the y-axis.
- The x-intercepts are the points where the graph intersects the x-axis.
- The vertex is the point on the graph that defines the graph's minimum and maximum values.
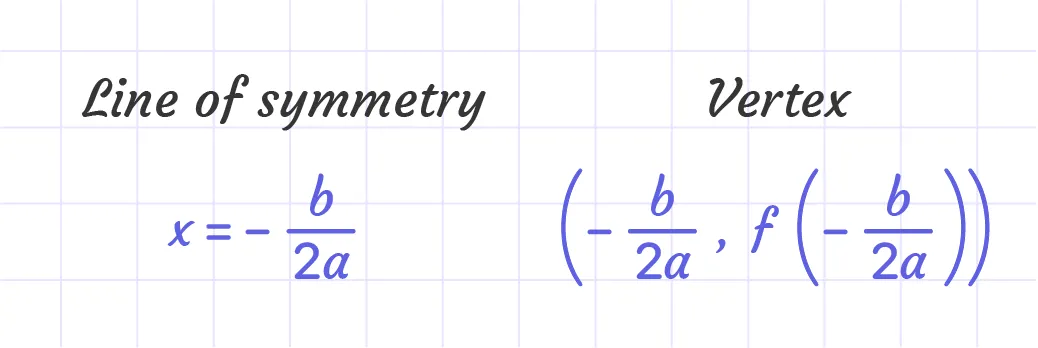
- Finally, the line of symmetry (also known as the axis of symmetry) is the vertical line that passes through the vertex and is symmetric.
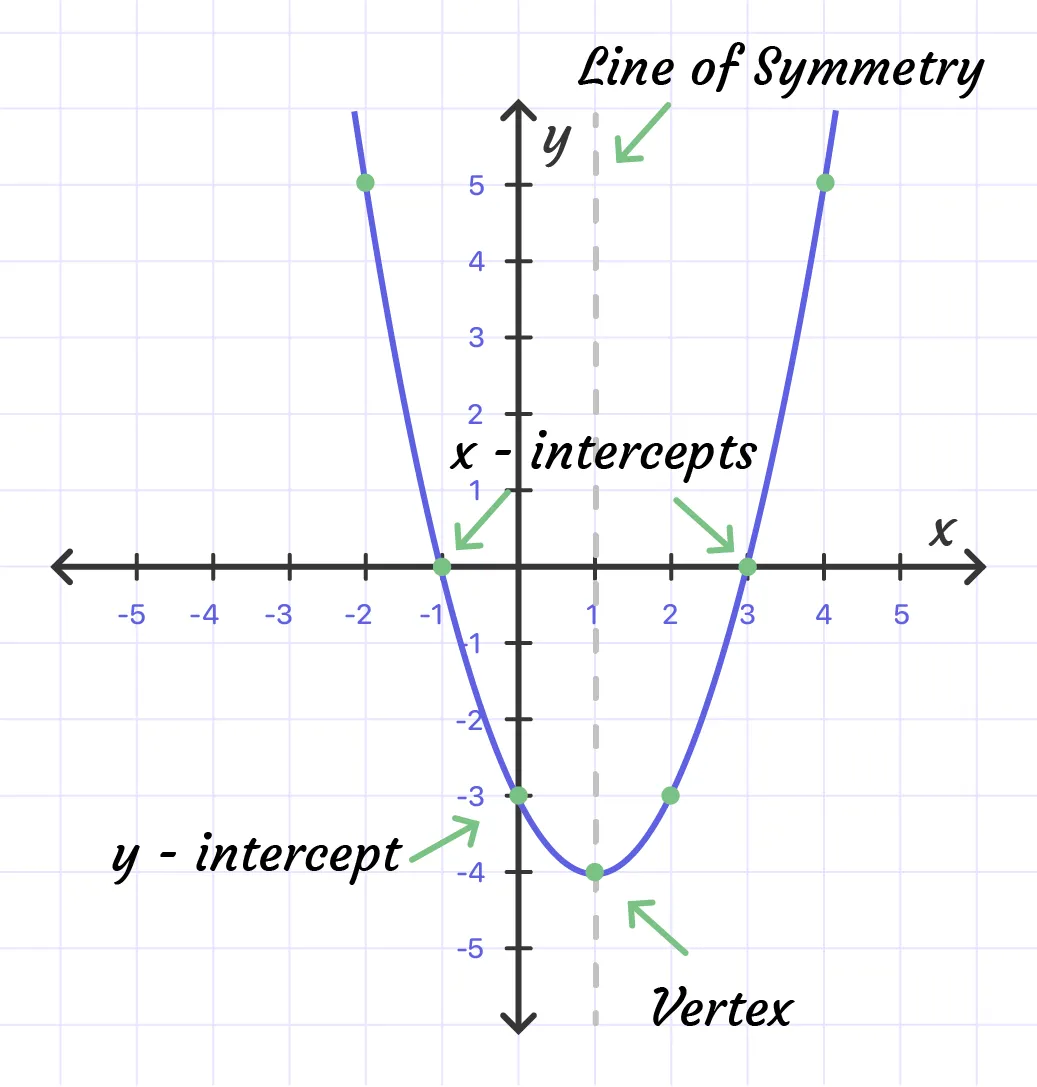
Given a quadratic function f(x) = aх^2 + bx + c, find the y-intercept by evaluating the function where x=0.
In general, f(0)=a(0)2+b(0)+c=c, and we have y-intercept(0,c).
Next, the x-intercepts, if they exist, can be found by setting f(x) = 0.
This way, we have aх^2 + bx + c which can be solved via the quadratic formula.
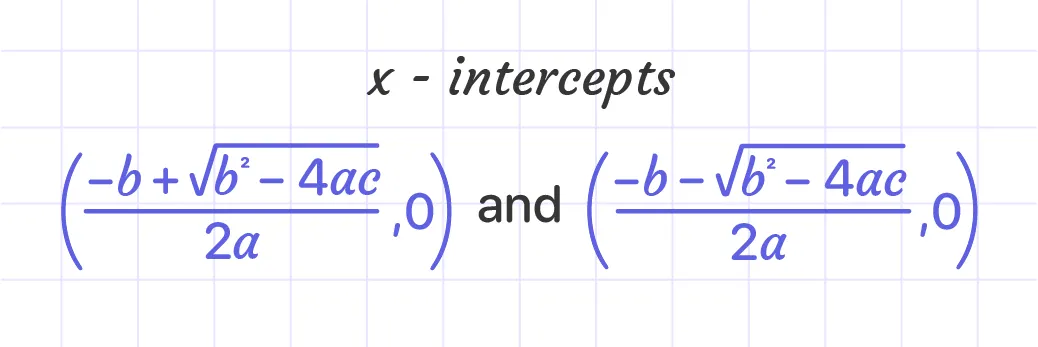
Thus, the x-intercepts can be presented this way:
We may use the x-intercepts to derive the vertical line of symmetry since a parabola is symmetric. To accomplish so, we average the x-values to determine the x-value that is halfway between the x-intercepts:
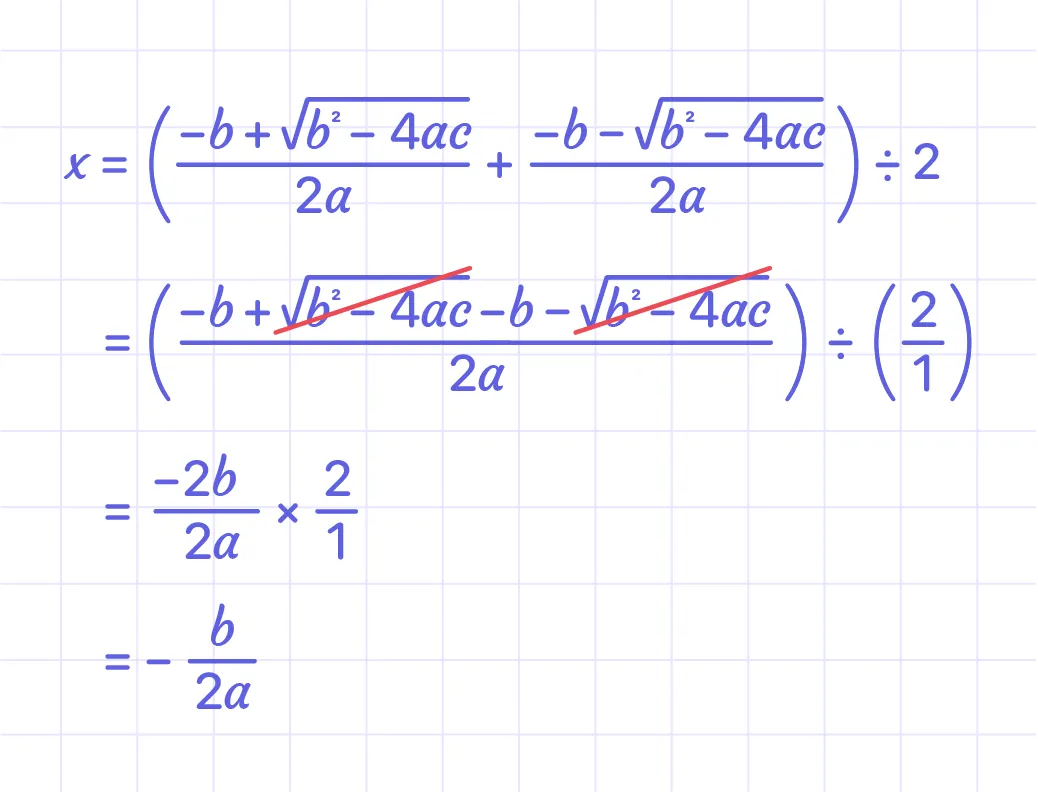
We can use the line of symmetry to find the vertex.
Example:
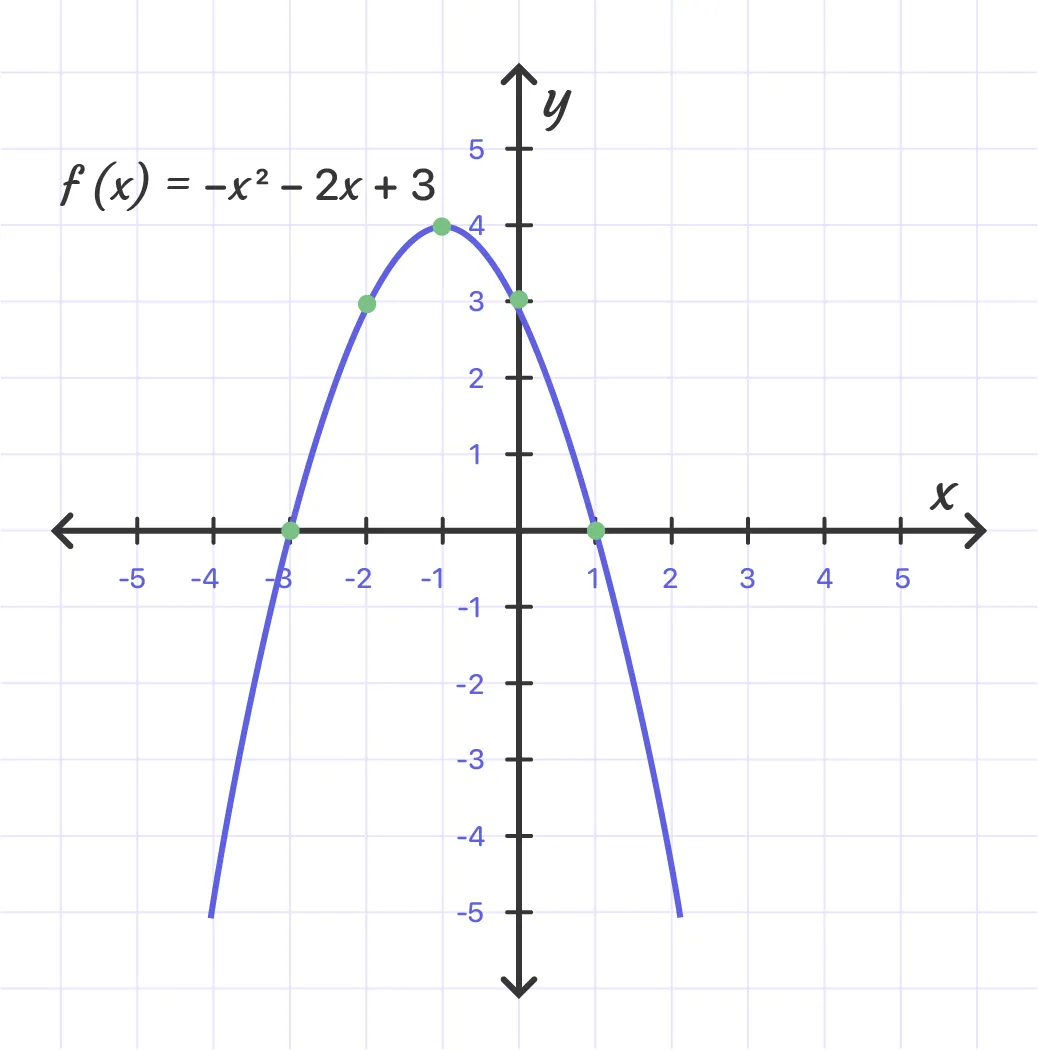
Graph: f(x) = −х2 − 2x + 3.
Solution:
Step1:
Determine the y-intercept. To do this, set x=0 and find f(0).
f(x) = -x^2- 2x + 3
f(0) = -(0)^2 - 2(0) + 3 = 3
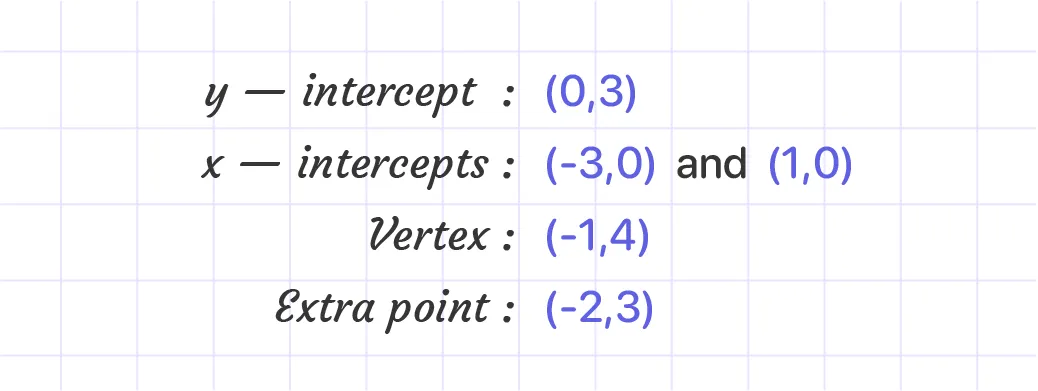
The y-intercept is (0, 3).
Step2:
Determine the x-intercepts if any. To do this, set f(x)=0 and solve for x.
f(x) = -x^2- 2x + 3
Set f(x) equal to zero:
0 = -x^2- 2x + 3
Multiply sides by -1:
0 = -x^2+ 2x - 3
Factor: 0 = (x + 3)(x - 1)
Set each factor equal to zero:
x + 3 = 0
x = -3
or
x - 1 = 0
x = 1
Hence, there are two x-intercepts, (−3, 0) and (1, 0).
Step3:
The next thing we need to do is to determine the vertex.
To do this, first, use x = $\frac{-b}{2a}$ to find the x-value of the vertex, and then substitute this value in the function to find the corresponding y-value. In this example, a = −1 and b = −2
So,
x = $\frac{-b}{2a}$ = $\frac{-(-2)}{2(-1)}$ = -1
To determine the appropriate y-value, substitute -1 into the original function.
f(x) = -x^2- 2x + 3
f(-1) = -(-1)^2 - 2(-1) + 3 = 4
The vertex is (−1,4).
Step4:
Extra points should be determined so we have at least five points to plot. Ensure adequate sampling on both sides of the symmetry line. One more point will be sufficient in this case. Choose x = −2 and find the corresponding y-value.

So, the fifth point is (−2,3).
Step5:
Make a graph out of the points you've plotted.
Answer:
