MathMaster Blog
The domain of a function is a set of input values that are used for the independent variable.
The range of a function is the collection of output values for the dependent variable.
A basic exponential function f(x) = a^x, has the entire real line as its domain. However, its range is limited to positive real values, with y > 0: f(x) never taking a negative value. Furthermore, it never hits 0, though it approaches asymptotically as x increases.
Example 1:
What are the domain and range of h(x) = 1.5(3)^x + 4?
Solution:
Step1:
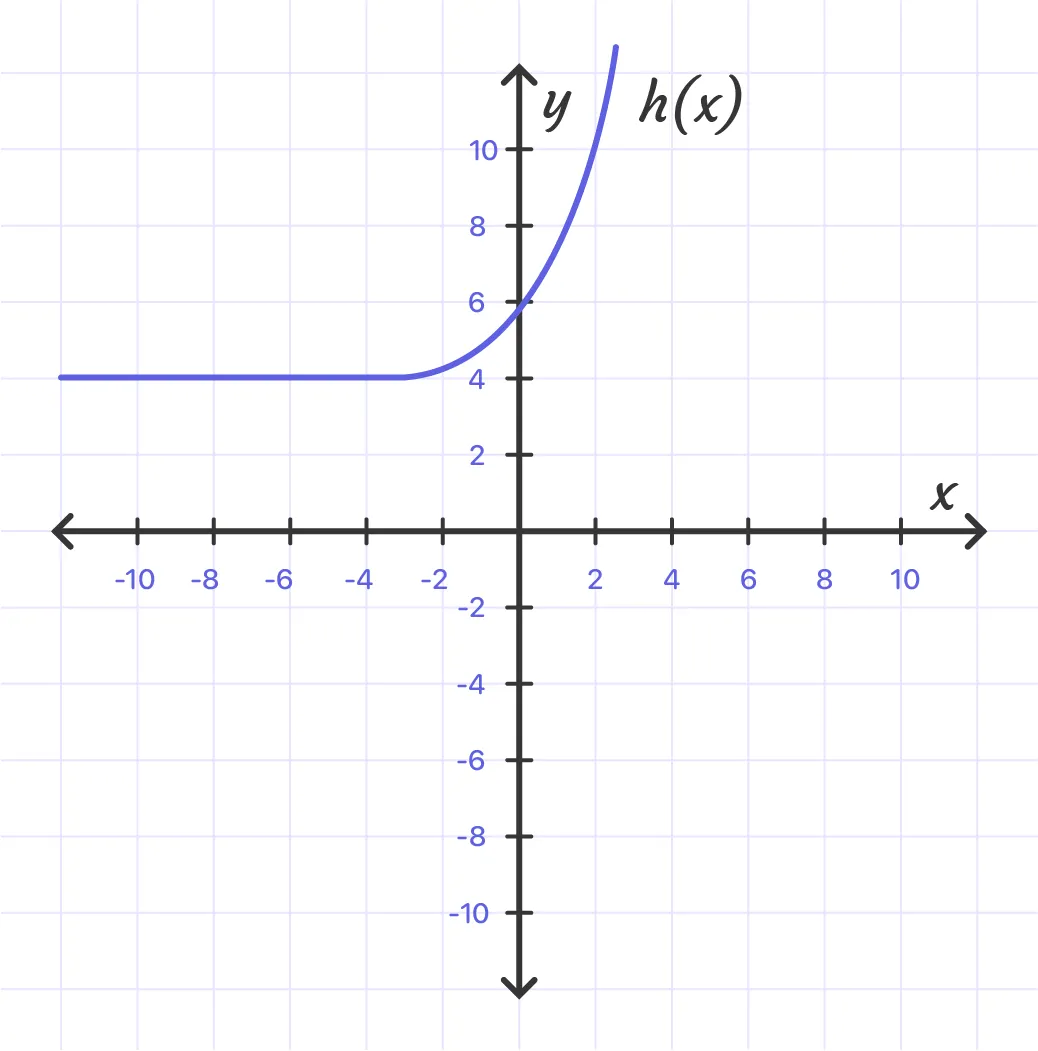
Graph the function to visually identify the range.

- As we can see, the function values increase as x increases.
- There appears to be a horizontal asymptote near y = 4.
- The value of a is positive.
So, the possible range is h(x) > 4.
Step2:
Apply the parameters in the equation to confirm the asymptote’s location.
In h(x), d = 4. Thus, the horizontal asymptote is y = 4.
In h(x), a = 1.5.
The horizontal asymptote is y = 4.
Step3:
State the domain and range of the function.
The domain of h(x) is all real numbers. The range of h(x) is all real numbers greater than 4, or h(x) > 4.
Example 2:
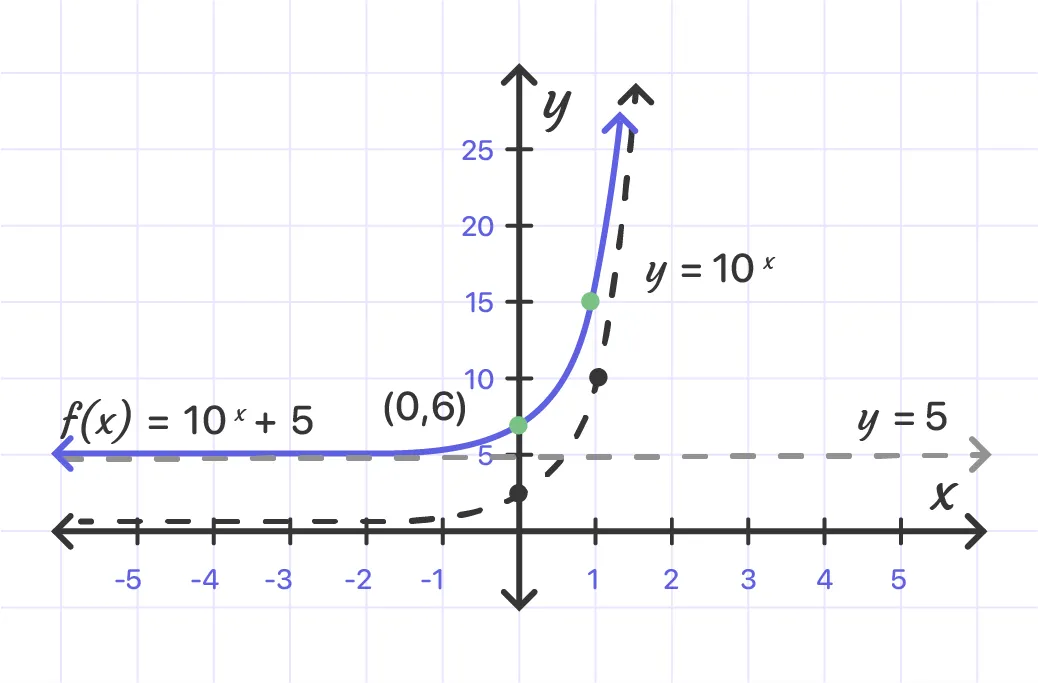
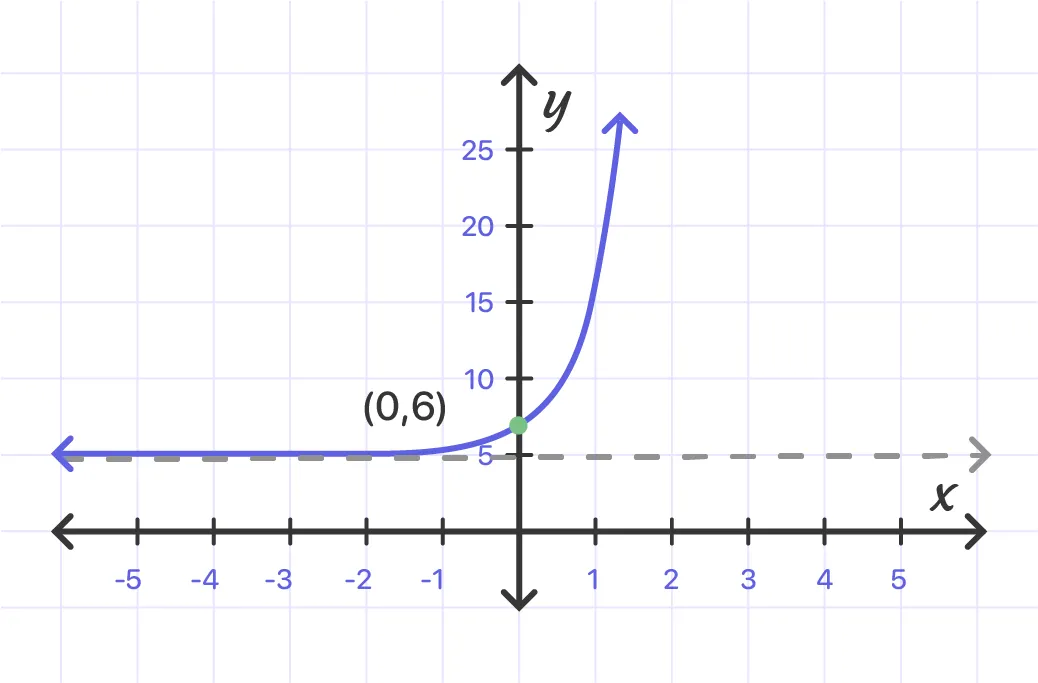
Sketch the graph and determine the domain and range: f (x) = 10^x + 5.
Solution:
Sketch the basic graph y = 10 and then shift it up to 5 units.

Answer:

Domain: (-∞, ∞);Range: (5, ∞)
Example 3:
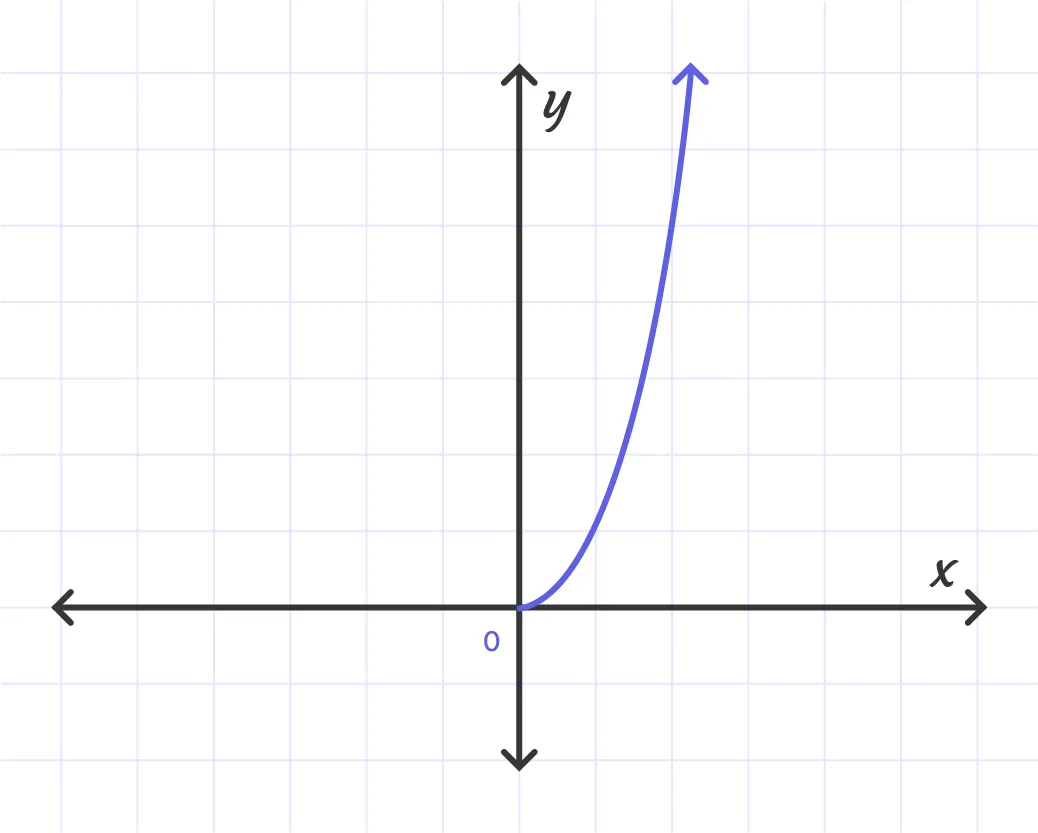
Graph and analyze function. Describe the domain, range, intercepts, end behavior, continuity, and where the function is increasing or decreasing.
f(x) = $x^{5/2}$
Solution:

Domain: [0, ∞);Range: [0, ∞)
x - and y - Intercepts: 0
End Behavior: $\lim_{x \to \infty} f(x) = \infty$
Continuity: Continuous on [0, ∞)
Increasing: (0, ∞)
Graph will be as follows:
