MathMaster Blog
An exponential function has the form of f(x) = a^x, where x is a variable and a is a constant which is called the base of the function. A should be greater than 0.
- Properties of the exponential function depend on the value of a.
- A never crosses the x-axis.
- When a = 1, the graph is presented by a horizontal line at y = 1.
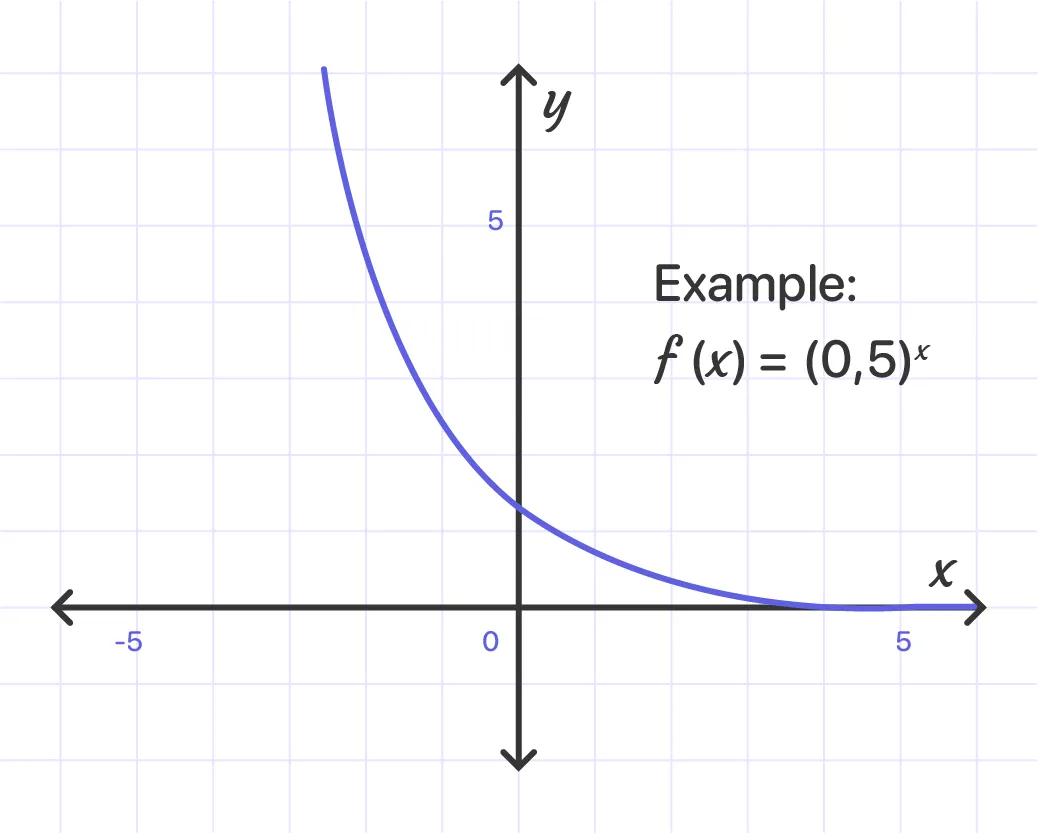
When a is between 0 and 1, we graph it this way:
When a is above 1, here’s the graph we have:
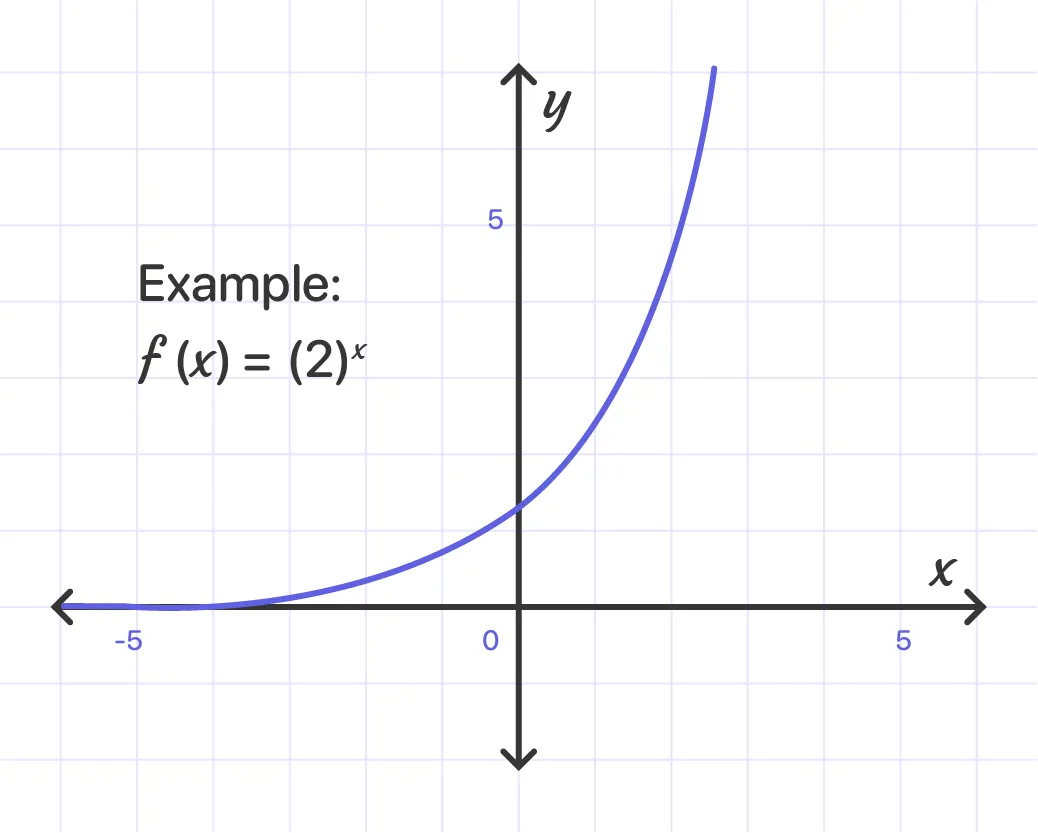
Example:
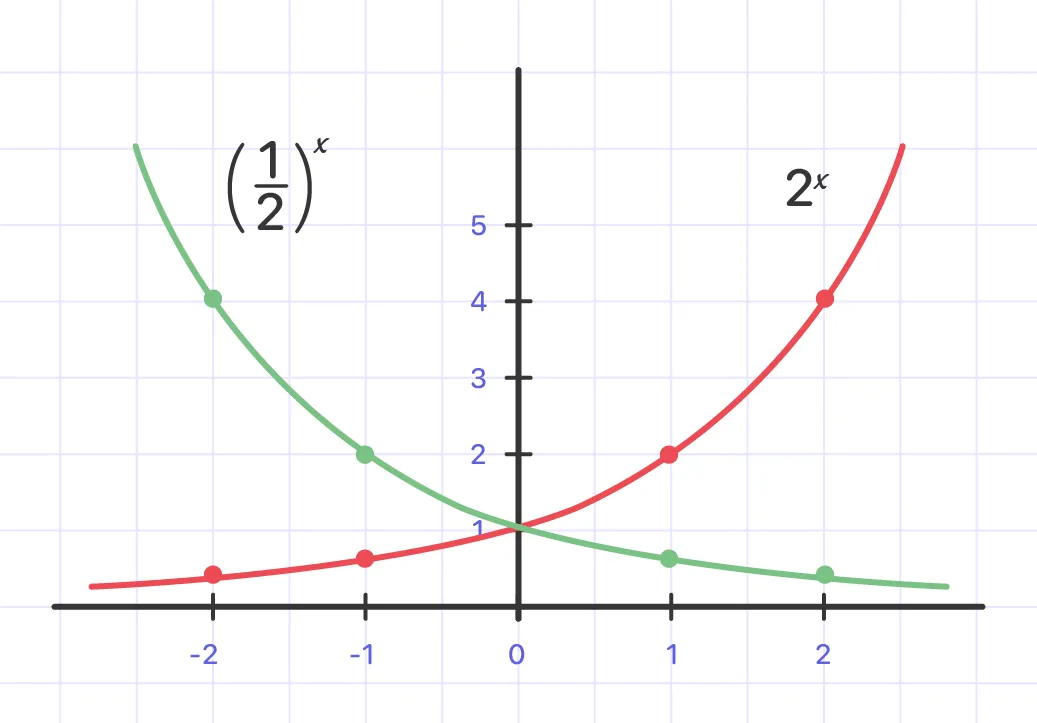
Sketch the graph of f(x) = 2^x and g(x) = $\(frac{1}{2})^x$ on the same axis system.
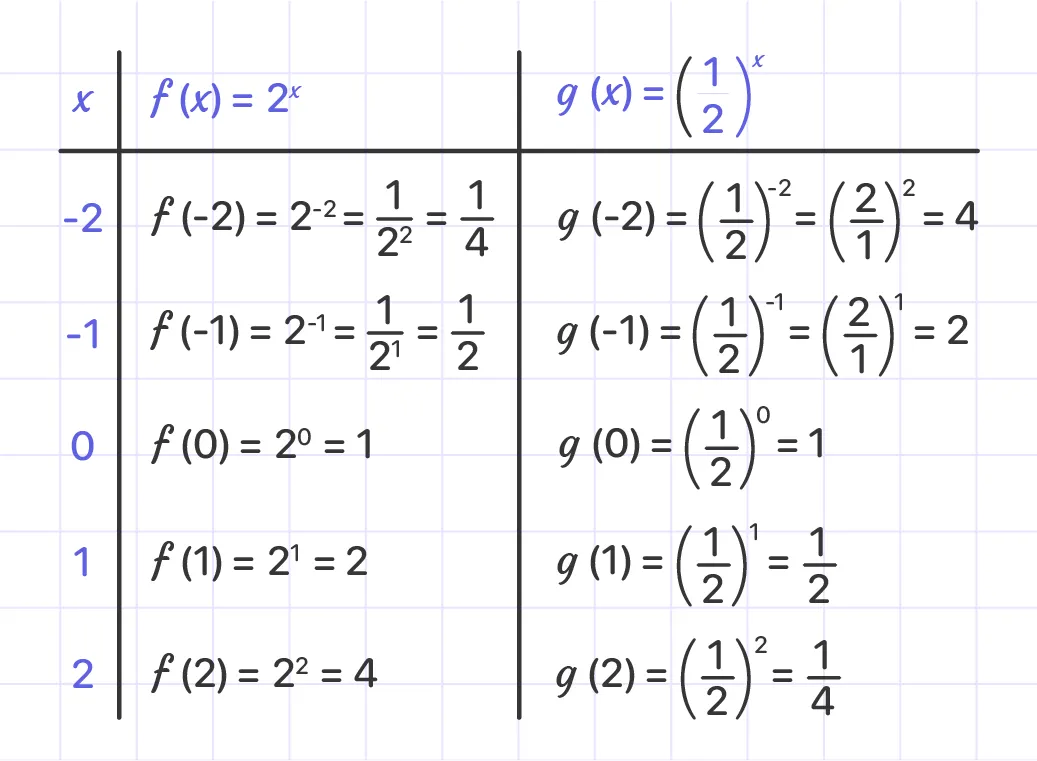
First, we have to pick some values of x and do some function evaluations.
Therefore, here is the sketch of the two graphs:
Example:
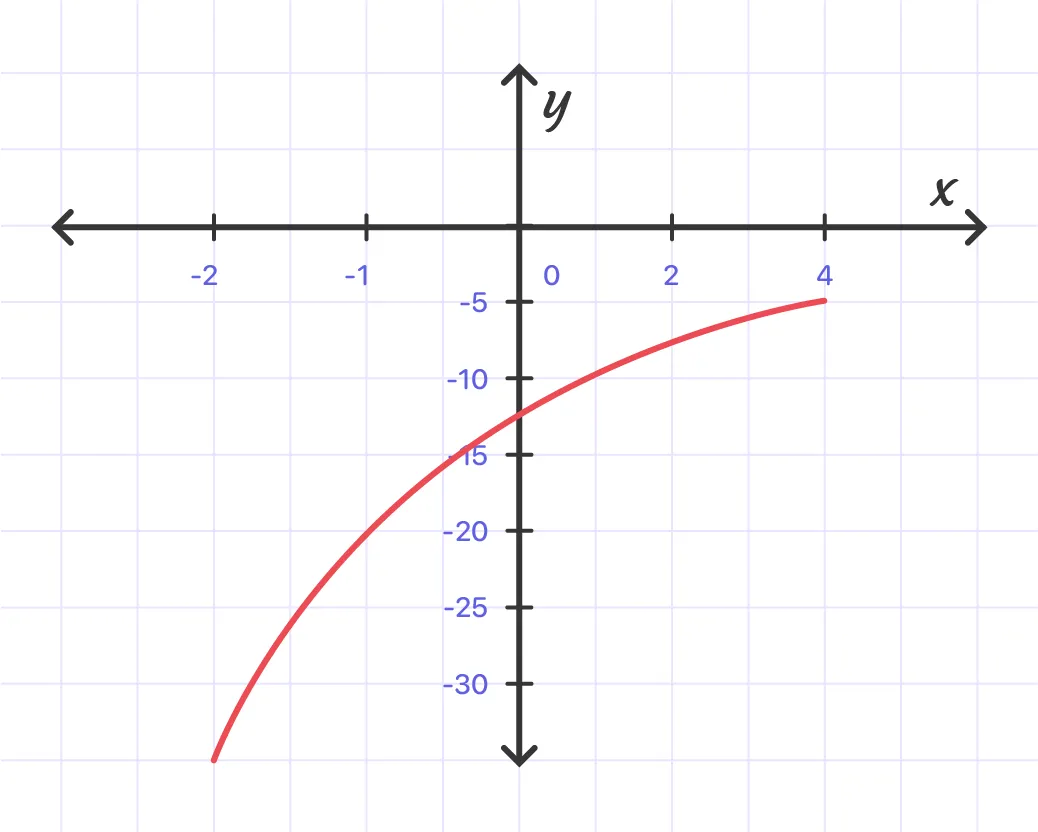
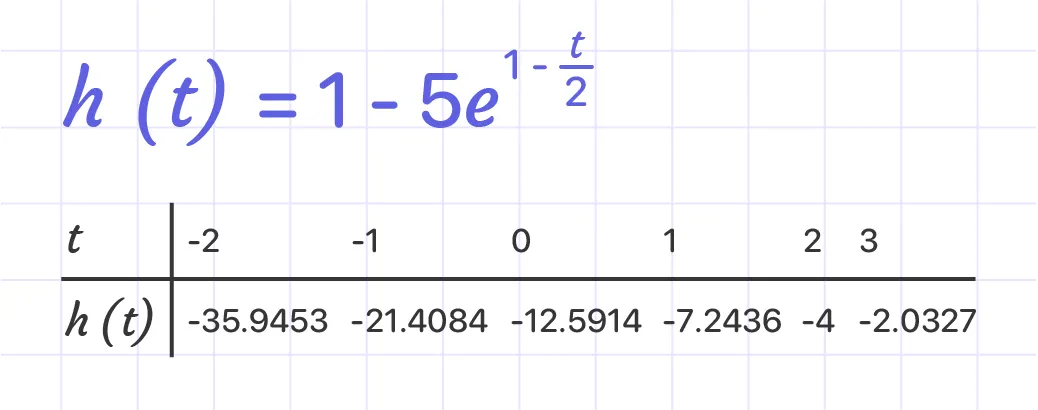
Sketch the graph of h(t) = $1 - 5e^{1 - \frac{t}{2}}$
Solution:
Step1:
Make a table of values for this function.
Step2:
Plot the graph.
